Keynote for AISTATS 2023 in Valencia.
You can find the slides here. Video coming soon.
Abstract: Evaluation in Machine Learning does not always get the attention it deserves. I hope to focus our attention for the time of this talk on the questions of systematic evaluation in machine learning and the changes that we should continue to make as we elevate the standard of evaluation across our field. The breadth of application areas we collaborate on in machine learning requires a variety of approaches for evaluation, and we’ll explore this variety by considering applications in generative models, social good, healthcare, and environmental science. Grounded in these applications, we will expand the conceptual aperture through which we think about machine learning evaluations, starting from purely technical evaluations (thinking about likelihoods), moving to mixed methods (with proper scoring rules and expert assessments), and then to sociotechnical assessments (considering fairness, impacts, and participation). My core message is that broad and expansive evaluation remains fundamental and an area into which I hope we will drive even greater investments as a community, together.
Thanks to the organisers (Jan Willem, Jennifer and Francisco) for the invitation and for hosting such an excellent meeting.
Evaluation in Machine Learning does not always get the attention it deserves. So my talk today is going to be about evaluation, metrics, and how we go about assessing the goodness of our methods. So the key word I want you to think about is measurement, and how we go about designing measurements. So please focus your attention for the time of this talk on the questions of systematic evaluation in machine learning and the changes that we should make, now, as we continue to elevate the standard of evaluation across our field and which all of you, especially the aistats community, has a big role to play. .
Let me say a little about myself as we begin, which will help put in context everything else that will come later. My name is Shakir Mohamed and i use the pronouns he/they. I know this work that goes on here and keep a regular eye on it. I have shifts and changed my approach to working over the years, covering topics in generative models and Bayesian analysis, all the ways to ethics and fairness. Today i try to split my time between AI for weather and climate, and then also sociotechnical and responsible research. So i hope to bring these two parts of my work together today.
So let me now jump to the topic for today. If we are going to talk about evaluation and measurement in machine learning, then we will need to ask a fundamental question: how do you match the real impact we want to have in the world, to the metrics we use in machine learning? How do we know that what we are training for, and later testing and evaluating, are the things that really matter? I‘m going to give you a few seconds to think about your view on these questions as they apply to your own work.
I think this means that what we want to have at our fingertips are methods of translation: tools and techniques that translate the complexity of a real-world problem space into a more simplified and tractable set of measurements.
When we have made significant advances in machine learning, there is often decades of prior work that has been devoted to this task of translation; and with the right translation, rapid progress becomes possible.
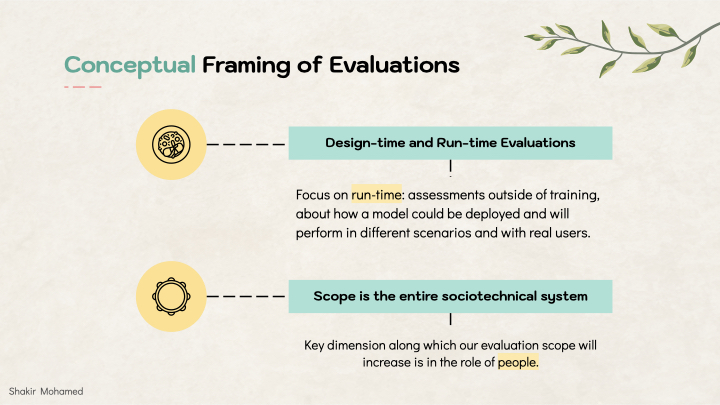
At the outset, let’s establish two conceptual framings for what we will discuss today. Firstly, on the type of evaluation. In machine learning, you could say we have two types of evaluations. There are the design-time evaluations, which are the measures and assessments we use to train our models, choose hyperparameters, do model selection, and design better models. And then there are the run-time evaluations, which are assessments outside of training, about how a model could be deployed and will perform in different scenarios and with real users and interactions. These two are of course connected and inform each other, but I’m going to focus on these deployment or run-time evaluations today.
The second conceptual frame will be the scope of evaluations. Evaluations in our discussion will go beyond technical measures, and I want to expand what we consider to be the scope of our evaluations. The key dimension along which this scope will increase is in the role of people. People includes us as researchers, people in other fields, sectors and industries, but also publics and people across the world.
So the talk will have 4 parts that will give a broad exploration on measurement: starting from the end of theory, then about technical measures, then mixed measures, then sociotechnical measures. Hopefully we’ll have some fun thinking about these topics, and by the end, everything will come together and make sense as a whole.
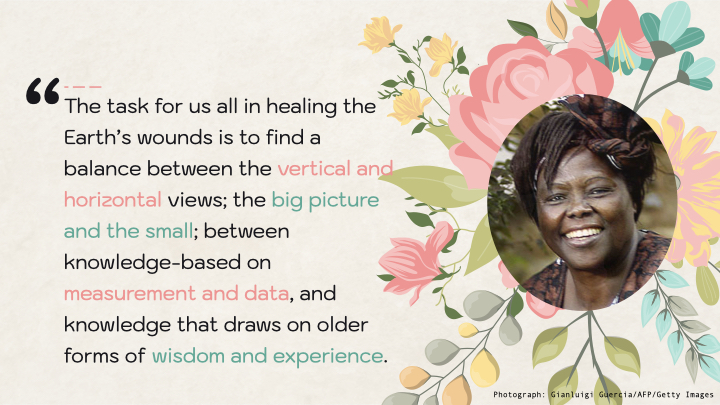
To have a sense of what that whole will be, allow me to invoke the words of Wangari Maathai, the Nobel laureate and one of our world's great environmentalists. Her words capture the theme and interconnectedness of my talk today.
Part 1: The End of Theory
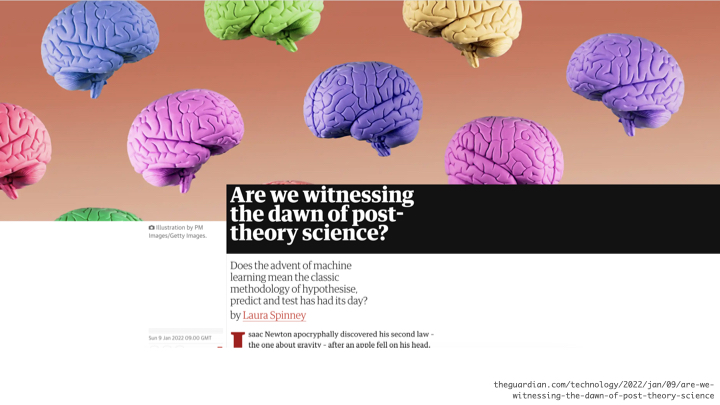
Every few years a provocation flows across our sciences declaring that we have reached the end of theory. Or as this headline asked, are we now in a post-theory science. Since we are able to collect more and more data, it became natural to ask if we could ‘let the data speak for itself’, obviating the need for theories underlying the processes the data was reflecting. By collecting ever-larger amounts of unstructured data and logs, we could skip the hypotheses, since data and its metrics and summaries could tell us about reality directly.
Now, data might be able to make this possible - scaling laws and ever larger generative models and their impressive outputs might suggest this. But even the most removed of researchers today are aware of dataset bias, sampling bias, issues of calibration, the problems of unfairness that emerge when we use data without questioning what and how it was collected in the first place, and how these basic problems can remove our hopes for positive impact, and instead, cause harm.
This means we now question our data and performance measures all the time, hopefully. And this process of asking what is and isn’t in our assessments, conveniently and unsurprisingly, is itself a process of creating and testing theories. A theory here isn’t just a set of equations describing a phenomenon, but can also be many other things, like a description or a process, a set of assumptions, and tests and criteria. So what is clear then, is that theory is still very much active and that, actually, we are all theory builders, and that we are doing it every day. The science of machine learning especially is still one that is all about theory generation, falsification, and regeneration.
The reason I’m bringing this up is because I wanted to connect our work in thinking about metrics and impact to the field of measurement theory. Science and measurement are intertwined with each other. In any discipline, scientific progress is strictly limited by the capacity to measure relevant concepts. In creating these measures and metrics, we are creating new theories. I’ll also say the obvious as well: that things we want to measure and the measurements we make, are not always, or even usually, the same thing. Because of this, we have to think about our measures, and because we can regularly get them wrong, there is at times a tenuous link between measurements and impact.
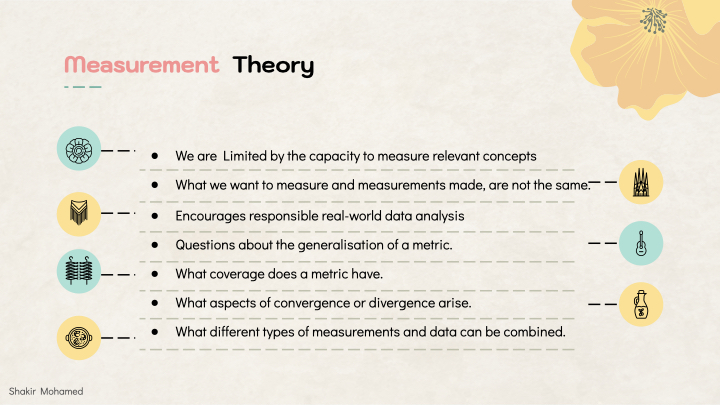
Measurement theory encourages us all to think about the meaning of our metrics and measures. It encourages critical assessment of the assumptions behind our analyses. It encourages responsible real-world data analysis. So a crucial part of a safe and responsible AI effort for us, starts with our metrics. But that, I think, is part of the exciting work of machine learning now and in the future.
Measurement theory raises questions about the generalisation of a metric across conditions and scenarios. What coverage does a metric have in the space of problems that we study. What aspects of convergence or divergence arise when it is used. What different types of measurements and data can be combined to reveal the impact we want to have.
In the discussion, I’d love to hear what tools and approaches for designing measurements you consider and use in your research. One conclusion I’d like to lead you to, is in the use of what are sometimes called mixed-methods of measurement: the use of deeply technical, automatic and quantitative assessments combined with qualitative and people-focussed methods. Their combination can reproducibly lead to clearer views of how a system works and the gaps between desired and actual impact. So let’s build up to developing some of these methods together.
Part 2: Likelihoods
Likelihoods are the basic tool of statistical fields and, for many of us here, the basic tool of measurement we use in our work is some form of likelihood (either as an approximation, a lower bound, or a perplexity). Likelihoods are our superpowers as statisticians. If we can compute a likelihood—so in some way know the probability of our data—we can use it to build efficient estimators, develop tests with good power, and understand the contributions individual data points make to our predictions. We can use likelihood functions to pool information from different sources or data, and can take on creative ways of handling data that is incompletely observed, distorted or has sampling biases. Likelihoods are an amazing tool for both learning and evaluation. But I want to emphasise their role in the evaluation of deep generative models.
Generative models learn distributions of observed data. Some classes of probabilistic and generative systems make the computation of likelihoods possible to evaluate or approximate directly, like graphical models or factor graphs. Other approaches, like generative adversarial networks or diffusion models, do not make computation of exact likelihoods easy or possible. Regardless, assuming you could estimate likelihoods in a probabilistic model, what are the things we might want to do?
Our models learn complicated, multimodal distributions, and we know they will be misspecified, so we’d like to use the likelihood to understand how our models are misspecified. We will want to know:
- Which modes have been dropped in a learnt model.
- Do we have an imbalance in the modes we have learnt.
- And in any specific mode or class, how well did we capture the diversity of data within it.
To answer these questions, we’d need some type of likelihood estimation method that does the following:
- Assigns probabilities to every data point individually.
- Allows us to include label information, if we have it.
- Is computationally tractable.
- Can be applied to a large array or models. In the most general form, we have a method that only needs samples from the generative model.
With these desiderata in mind, the tool we suggest to look at is the Empirical Likelihood. The empirical likelihood does not seem to be often studied in machine learning, but one I hope many of you will pick up on. It is a classical non-parametric method of statistical inference, and it will be intuitive. The classical empirical likelihood is a method for inference on the mean - so that is a way of doing a statistical test of whether we estimated a mean correctly.
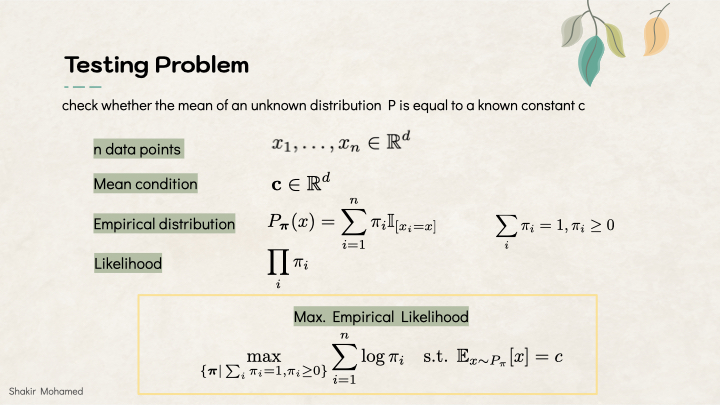
The testing problem can be stated simply as: given n independent samples x1 to xn in Rd from an unknown distribution P, check whether the mean of P is equal to a known constant c. To do this, we will model the set of these samples with a weighted empirical distribution, which constructs the probability by computing a set of weights pi_i, with the condition that the weights are non-zero and sum to 1. We want to maximise the likelihood i, and find the weights that best match the mean condition. The empirical likelihood is then the solution of the convex problem with objective

This is going to look a lot like the method of moments and other related estimation methods, so that is also a rich theory we can look to. To use this for machine learning evaluation, we should first generalise this optimisation.
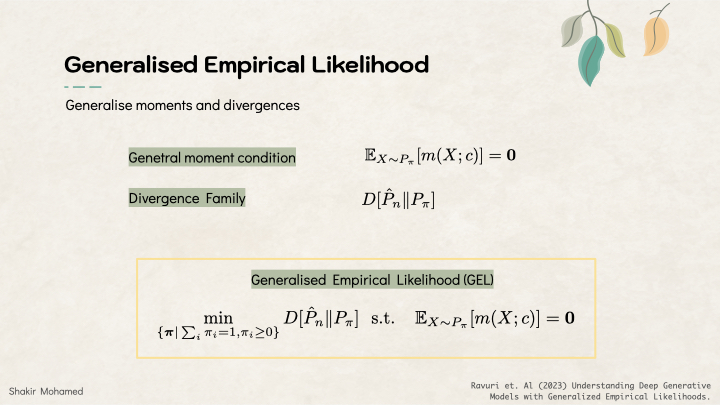
Firstly, let’s replace the mean condition, by a more general condition that allows us to match moments of summary statistics from test or evaluation data we have available. So instead of using Ep(x)[x]=c, we use Ep(x)[m(x; c)]=0, using a moment condition m. This change will allow us to match different types of feature vectors or latent representations we may have available, giving us more flexibility in using representation learning tools.
Secondly, let’s do what we always do in machine learning, which is to generalise to a more general class of divergences. In the empirical likelihood, if you squint a bit, you’ll see that the likelihood maximisation follows the use of the KL divergence. So we instead use a general class of divergences.
This will give us the generalised empirical likelihood or GEL:

There is a lot of technical detail into the choice of divergences, unbiasedness of estimators, and setting up the optimisation problem, that I’ll refer you to the paper for the details. I want to keep our focus on what this lets us do for evaluation. To evaluate a generative model, you have both samples from the data, and samples from the model. We need to choose the moment conditions that will give us a way of comparing the testing data and the samples. And with progress across machine learning, we now have many different tools from representation learning: we can use the pool3 layer features from an inception v3 network (or a layer from another pretrained classifier), use the BYOL features, or other test statistics that are known from the specific problem if we have that knowledge.
In generative models two issues of note are mode dropping, where some parts of the data are not represented, and mode imbalance, where there is an under-representation of the data in individual modes. Because GEL will assign a weight or probability to every test sample, we can use this to individually interrogate samples of the model. In a constructed scenario using CIFAR 10 data, we can use the weights to show when certain classes have been dropped or not learned, and to show that GEL is not sensitive to the types of representation space used.
We can use the GEL weights to identify samples the model can’t represent, and identify samples from the model outside the data distribution. Here we can use GEL to show that BigGAN is least able to represent butterflies when they take up most of the space of an image or when there are swarms of butterflies. Cascaded diffusion models are least able to represent swarms of butterflies.
DGMs often employ a mechanism for trading off sample diversity and sample quality. And we can use GEL to gain a deeper understanding of these tradeoffs that are being made. In diffusion models there is the guidance scale, and for GANs there is a truncation trick. And using gEL we can check the number of points with zero probability and find the right parameters to best match the data distribution.
New technical methods for evaluation of generative models are now essential for us as a field to continue investing in. I think this is just the beginning of GEL as a method, and hopefully also much more research from many of you here, in particular on the role of testing and evaluation of high-performing generative models that are so widely-used these days.
So far we’ve been speaking about computing and using just one performance measure, the likelihood. But single measures can’t tell us everything, and neither can highly-technical and automatic measurement approaches. With that insight, let’s move on to a new theme.
Part 3: Mixed Metrics and Mixed Methods
Because we have a focus on generalisation and generality by learning from data, our methods can often extrapolate outside of the domain of the training data in unusual or undesirable ways. In the physical sciences for example, there will be an implicit role of conservation laws, and we might not account for those in purely data-driven predictive systems. This leads uncontroversially I think to a need to move beyond a focus on a single metric and using it to decide what is the top of a leaderboard. But, to a much richer way of reporting the performance of our work. So I will refer to this as a mixed metrics approach. But I want to push our thinking further, and have our assessments include both quantitative, but also qualitative methods of assessments. And these we call mixed methods approaches.
Let’s think through all of this as it applies to the field of environmental science, which is one that I have been working in for several years, and an area I believe has many, many opportunities for highly-impactful collaborations and new successes for machine learning research. In environmental and atmospheric science, we have several types of problems, based on how far into the future we want to make predictions.
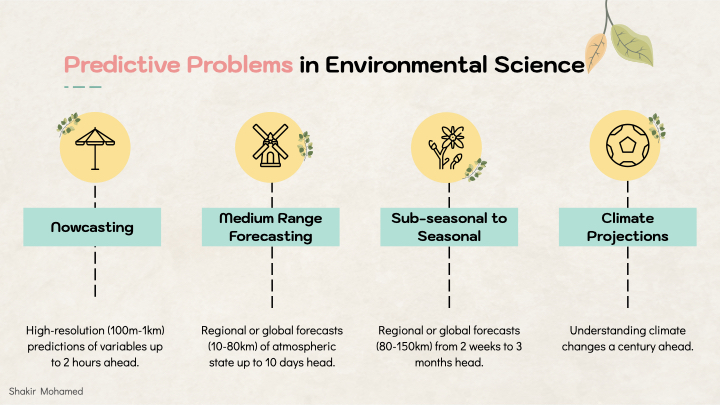
- The shortest time scale is known as nowcasting. This is the prediction of atmospheric variables, like rainfall, up to 2 hours ahead and at high spatial resolution, from 100m to 1 km.
- Time horizons from 1-day to 10 days are referred to as medium-range forecasts. You can do this for a regional basis, but these models typically operate at 10-50 km resolution and provide predictions of the entire earth.
- We can extend to 1-3 months, which we refer to as sub-seasonal to seasonal predictions (S2S).
- And then you can get to the climate projections, which involve predictions 100-200 years ahead.
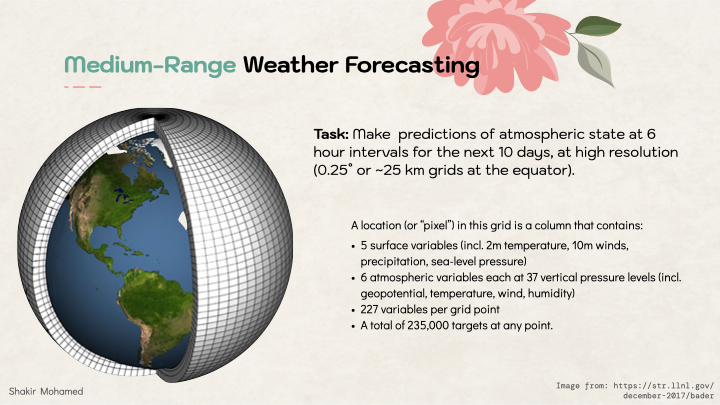
Let me start our mixed metrics discussion by considering the problems of medium-range global weather forecasting. Predictions in this area are truly one of the incredible feats of science and numerical and statistical forecasting. Weather predictions are ones we all rely on every day, directly or indirectly, and with applications wherever we have commercial, industrial or social needs. Right now is an incredibly exciting time, since Machine learning is making significant inroads into this area. In our own work, the prediction problem involves making predictions in 6 hour intervals from 6 hrs to 10 days ahead, at around 25 km spatial resolution at the equator. In the data we used, each “pixel” in this grid on the earth contains 5 surface variables, along with 6 atmospheric variables each at 37 vertical pressure levels, for a total of 227 variables per grid point. So that means 235k variables for each time point we want to make a prediction for. There is a lot of complexity here, meaning that we need several different metrics, and a way to show all these different moving parts.
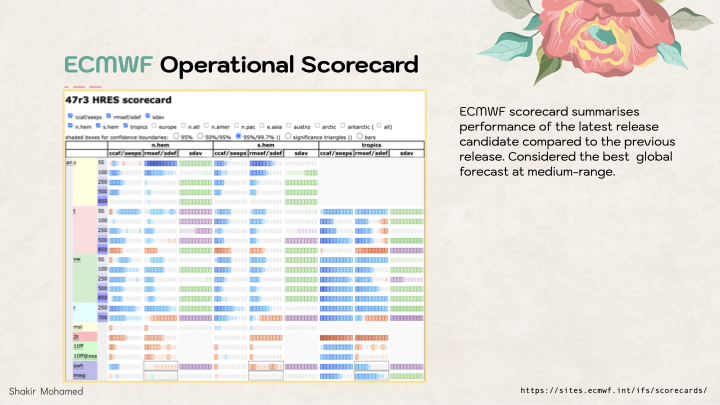
One thing that researchers in atmospheric science do well, is to report performance using a scorecard. These scorecards visually summarise performance across different variables, and using different metrics. Importantly, they also show performance across different subsets of the data, like performance for the southern hemisphere vs the northern hemisphere, or mountainous vs coastal areas. This scorecard shows what this can look like. One thing that is important is that it shows performance relative to a strong baseline, usually the current system used in operations, and indicates statistical significance at different levels (99.9%, 99%, 95%).

Scorecards are how improvements from new research can be reported in operational or production settings. Here is a scorecard that is reported every-year for the world-leading medium-range weather model from the ECMWF.
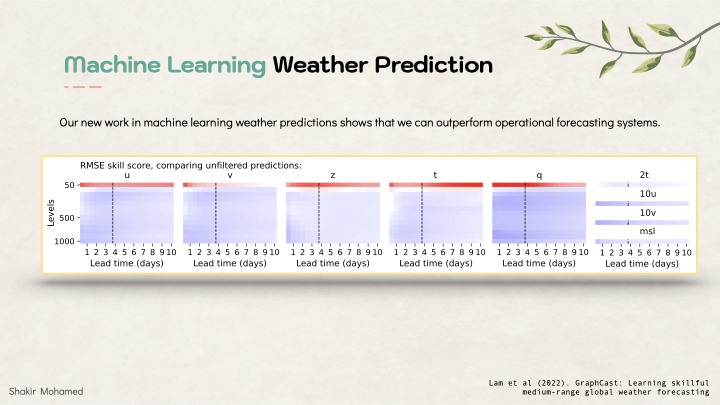
And here is one for own work, that shows that machine learning can outperform operational weather systems.
Communicative tools like this that show complexity, but in manageable ways, will be essential as we continue to elevate our evaluations approach.
I’m going to stay in environmental science to explore some other aspects of evaluation, but now thinking of evaluations of generative models for nowcasting rainfall.
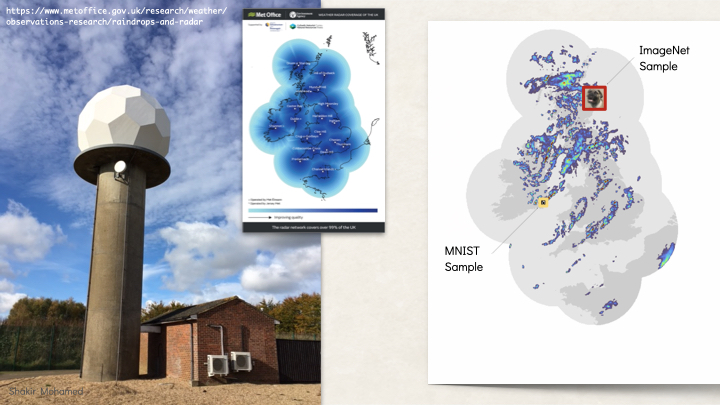
The nowcasting problem is all about very short term rainfall predictions: the type of next-hour predictions of rain you find on many weather apps today. In many countries, there are ground stations that use radar to measure the amount of moisture in the atmosphere. For example, the UK has radar that covers 99% of the country and provides data at 1km resolution (and even lower up to 200m), and available every 5mins. For 1km data, this gives us data that looks like an image of size 1000 x 700 pixels, where every pixel is the accumulated moisture level in units of mm/hr.
This is also one of the perfect problems for generative models, since we need tools to generate realistic looking radar data, and a critical need to generate many samples to report the uncertainty of possible future rainfall. We eventually developed a highly competitive approach using generative adversarial networks.
In nowcasting, we could have impact by focusing on every day consumer needs. That would lead us to focus on problems that emphasise making good predictions of low-rainfall, because as everyday people, our needs are more about rain or no-rain. Or, we could focus on the other end, on the needs of meteorological experts and operational users, who care primarily about heavy rainfall, because it is heavy rain that most affects everyday life, and where the protection of life and property matters significantly. Ideally we can do both, but our focus on the needs of experts and the role of crucial decision-making information meant that throughout our work, all our metrics of performance had an emphasis on heavy rain - the top 10% of rainfall events. That in turn influenced how we thought about our models and how we worked with the data. It is also for this reason that we focussed on predictions up to 90mins, since this is the time window for action in operational settings.
The conclusion from our collaboration with expert meteorologists, both researchers and those who work in operational forecasting centres, was clear: for nowcasting to be useful in operational-uses the forecast must provide accurate predictions across multiple spatial and temporal scales; account for uncertainty and be verified probabilistically; and perform well on heavier precipitation events that are more rare, but more critically affect human life and economy.
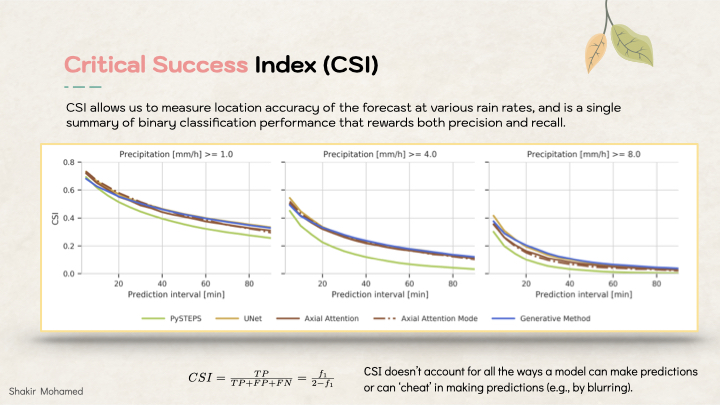
We also quickly discovered that when deep learning meets weather, the performance of different methods can be difficult to distinguish using traditional forecasting metrics: metrics need to have enough resolving power to help distinguish meaningful differences in our predictions and samples. These metrics can’t account for all the ways that we might ‘cheat’ in making predictions with ML. For example methods could make more blurry predictions as a way of spreading uncertainty, or can add high frequency noise, or can be physically inconsistent as you accumulate over space.
One of the common metrics is called the critical success index (CSI), which evaluates binary forecasts of whether or not rainfall exceeds a threshold t,and is a monotonic transformation of the f1 score. It can show that deep learning methods can outperform the existing approaches, at the time the most competitive approach was known as PySTEPS, which is an optical flow approach. But this metric doesn’t help show differences between deep learning approaches that you see with all the clustered lines on this graph.
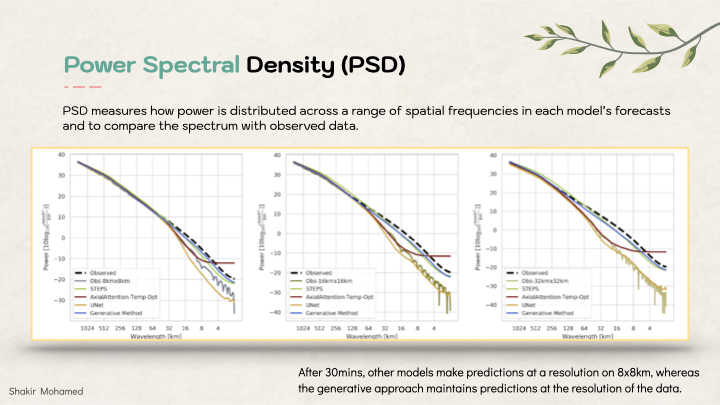
To add to this analysis, we can compare the power spectral densities of different predictions - we want predictions to match the spectrum of the data. It shows us blurring, and the introduction of high-frequency noise from many deep learning methods. After 30mins, other models make predictions at an effective resolution of 8km x 8km, whereas the generative approach maintains predictions at the 1km resolution of the data.
Since we are interested in probabilistic forecasts, we can show the continuous ranked probability score (CRPS), and compute it over several spatial scales, to show that generative models in this application provide consistent forecasts across spatial scales.

When you look at these together you can tell the story of the role of generative models in creating a new generation of nowcasting approaches by showing that the forecast quality and forecast consistency of our method was performing better, in statistically significant ways, than competing approaches.
Here you can see what some radar data looks like, and how different methods compare. This is a case study of very challenging rainfall pattern over eastern Scotland and the observed data. This case was also chosen by the chief forecaster at the Met Office, who was able to give us a test chosen independently of our project team.
- We compared to the incumbent method called PySTEPS based on optical flow.
- And also compare to the ever-popular UNet approach, which we also later incorporated into the generative model.
- And compare to another popular deep learning approach.
- And finally here is the performance of our generative model approach.
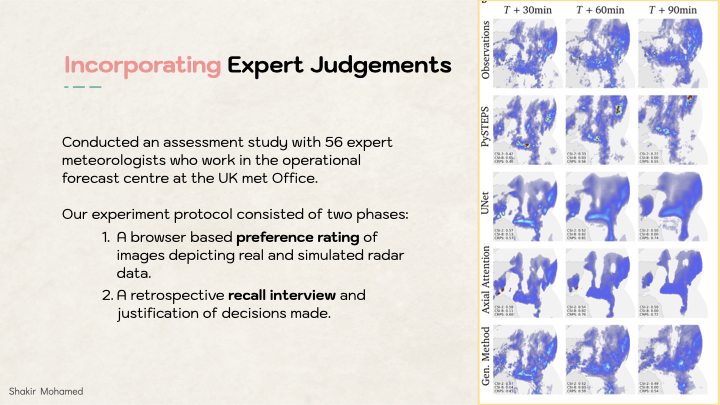
But coming back to this idea of mixed methods, and the fact that we were working with expert meteorologists, this was an opportunity to include their judgements as part of the assessment of this approach. And this is what we did. Experts who were working in the forecast centre, were asked to take part in 2 phase evaluation study.
- In the first part, they had to make assessments on a rating scale of several different nowcasts.
- For a second part, a subset of meteorologists took part in a followup retrospective recall interview. This approach means that we had to learn about and include evaluation methods from other fields, especially from interview methods and psychology.
Together we showed that almost 90% of the experts in our study preferred the generative approach compared to alternatives, and in this way we were able to demonstrate the ability of generative models to provide improved forecast value. And because of the mixed approach, it was easy to provide evidence that the experts were making informed and reasoned judgements based on meteorological insight and were not fooled by things like visual realism of the generative models we were using.
This is what some of them had to say:
- “I like things to look slightly realistic even if they’re not in the right place so that I can put some of my own physics knowledge into it.”
- “I would prefer the model to underdo intensities but get a much better spatial variation”
- “This looks much higher detail compared to what we’re used to at the moment. I’ve been really impressed with the shapes compared with reality. I think they’re probably better than what we’re currently using. The shapes in particular, some of them do look really high resolution”
There will always be gaps in our evaluation approaches. But mixed methods approaches that combine quantitative and qualitative approaches allow us to tell the more complicated stories of the problems we are working on; and ensure that we are always focussed on providing genuine decision-making value for use by real-world experts and users.
We are on a journey where we are expanding our evaluations approach: from the likelihood and studying one metric, to multiple metrics and mixed methods.
This latest step brought people into our evaluations, and so for our final part, I want us to refocus our attention one more time, but this time to the places where technical methods and people meet, and what methods of evaluation might be needed to understand interactions that emerge there. So onto:
Part 4: Sociotechnical Assessments
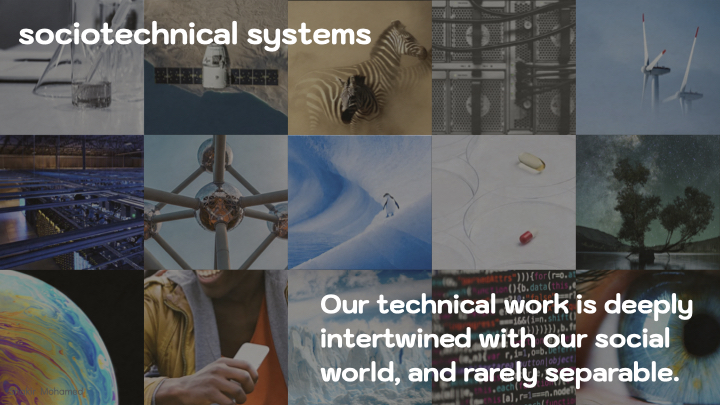
This is a new word I’m using, sociotechnical, simply combining the terms social and technical so we can think about them not as separate domains of research, or impact, or concern. We use the word sociotechnical to draw attention to the reality that our technical work is deeply intertwined with our social world, and that they are rarely separable. Technical systems and advances are co-created with the social world of people: driven by the ambitions of researchers and institutions, built by work that has come before, and motivated by the needs of people and markets. The social world is in turn affected by technology: changing how we interact, speak, play, and govern.
Even before I dig further into this topic, what I would love you to take away as homework, is to later answer two questions: How is your technical work shaped by social factors? How does your work try to shape society?
These two questions are good starting points for the topic of evaluations, because they will help us think about the more expansive ways in which we need to think about evaluation and impacts of machine learning. Healthcare is one example that motivates so many of us, and a good and direct way to think about the interaction of the social and the technical.
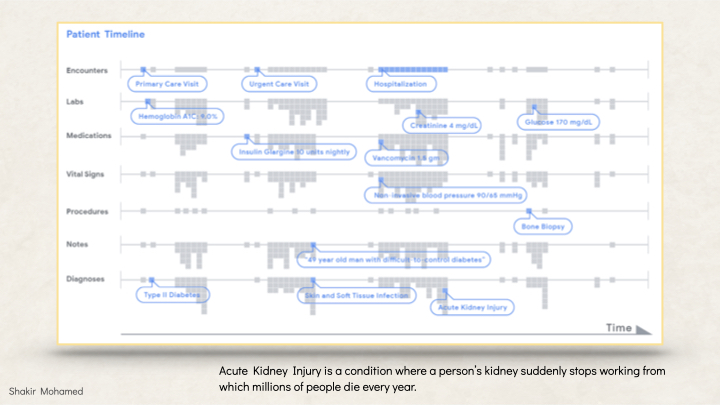
Consider the problem of predicting organ damage in hospitals. Today, 1 in 5 people who enter hospitals in the UK (where I live) or the US for example suffer from what is often called the silent killer, a condition known as acute kidney injury, or AKI, where a patient’s kidney suddenly stops working properly. This is a clinical problem, but one that is deeply connected to many scientific problems in biology, drug development and optimisation. Millions of people die every year from AKI, and these deaths could be prevented if we could detect AKI earlier.
So this poses an opportunity: there is a deeply technical problem where our expertise in machin learning can be useful, and a set of problems that have the opportunity for real positive benefit.
The data for this problem comes from patient data known as an electronic health record, or EHR. EHRs capture data from all areas of a patient’s engagement with the health system, with data from radiology, microbiology, vital signs, operating theatre information, medications, doctors notes, and other data streams.
This data is often unstructured, can be noisy, and can be recorded differently or treated differently in different hospitals. And of course to handle such data we need to consider many essential questions about data security, privacy, what is allowed under the law, anonymisation, access, and systemic inequalities, amongst other concerns.
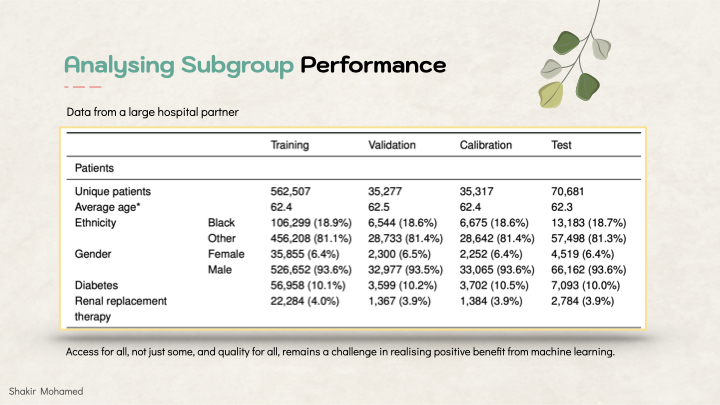
In my own work in this area, using data from around 700k patients across hundreds of hospitals and clinics, we were able to develop an AKI model that was able to make predictions of AKI into one of 3 categories of kidney function, detecting the most severe cases of AKI with 90% accuracy.
When we expand the set of considerations of our evaluations, then we also need to think about how people enter into our assessments. The most prominent way we do that today is to analyse how models perform across different sub-groupings of the data, not unlike how we looked at subgroups in environmental prediction problems earlier. For subgroups of people, we often speak about analysing the fairness of our models; and our models will be unfair when they have different performance across different groups of people.
The data we used was from US veterans, so at the outset this is not a data source representative of global populations. Female patients comprised just 6% of patients in the dataset, and model performance was lower for this group. We extended our analysis, to consider the performance on Black patients vs other patients as it was coded in the data, looked at those with diabetes, across ages groups, across the types of medical facilities they visited. Subgroup analysis and intersectional performance is now an essential part of the evaluation approach for machine learning methods. And while this is a technical assessment, it is also social, since to really use these methods in practice would be to account for how we got the data, why some people are represented in the data and others are not, to be explicit about the social and racial biases inherent in how labels and ground truth is decided, and to remain humble in what the actual benefits of our work can be.
While access to powerful models is important, and the accuracy of those models is important, it would be wrong to claim success using narrow definitions of access and quality. Access for all, not just some, and quality for all, remains a challenge in realising positive benefit from machine learning.
In this AKI study, knowing legal gender, or self-identified race, or the age of patients, were available in the data. But this won’t always be the case. In fact there are many characteristics of people or subcategories of data that may not be available, may be difficult to characterise, or be fundamentally unknowable. This raises the question of what fairness means for these types of unobserved characteristics.
Questions like these raise the importance of why maintaining our focus on diversity and inclusion in our field is so important. Diverse groups of researchers have the capacity to both use their life experiences in combination with technical expertise to explore solutions for these types of questions, ands to encourage others to work on them. To connect the dots here, this is just another way to understand the sociotechnical nature of machine learning.
A group of us, using our identities as queer researchers, looked at this question of fairness for unobserved characteristics and the impacts on queer communities specifically, and how we might understand, and evaluate this need. We don’t have have all the answers for difficult questions like this, but we reached one clear conclusion from this work. One resuabale methodology available to us right now to understand and evaluate uncertain sociotechnical problems, is to find ways for different types of communities—those who are marginalised, and those who are most vulnerable—see to become part of addressing the problem. The emphasis of the most vulnerable is important: when we can make our technological tools better for the most vulnerable, we make them better for everyone.
This last point brings me to the final piece of work I want to connect with. We have expertise as technical designers, but we know we can’t know everything. There are other forms of expertise available, and in some cases we know how to recognise and include that expertise, like the expertise from other fields that came up in all the collaborations I tried to showcase today. But we also need to recognise forms of expertise beyond the technical, and that the experiences and views of those people who are vulnerable and stand to be most affected by our work, alongside those who will benefit, is a form of expertise we can bring into our technical work. We refer to this as participation.
Participatory approaches for AI are gaining momentum. But participation does not mean using people, like raters or annotators to evaluate our methods — that is not a form of participation. Participation means including people in the design of our methods, and being open to changing what we work and how we work, based on their input. Participation changes the nature of how we evaluate ML systems, making it people-centred, and turns it into an ongoing process. Participation done well can place our work on stronger ethical foundations by incorporating and accounting for the values of the societies we operate in.

Wrapup
I won’t say more since my time is up, but my aims today were to leave you with two thoughts:
- Firstly, we are all theory builders. And that theory building is part of the way that we are involved in responsible research processes, today and for the future. Broad and expansive sociotechnical evaluation remains a fundamental need, and an area into which I hope we will drive even greater investments as a community, together.
- Secondly, that using mixed methods of evaluation—evaluations that use probability theory and likelihoods, that mix scoring rules and expert assessments, that are fair and participatory—will elevate our work in the statistical sciences. Mixed methods will allow us to be more rigorous, to be more people-centred, to work from stronger ethical foundations, and allow us to see and work with the real complexity of the problems we work on.
I thank you for the opportunity to put some of these ideas out for discussion today. It’s a real privilege to be in conversation with all other amazing speakers here this year, but especially to discuss this with all of you.
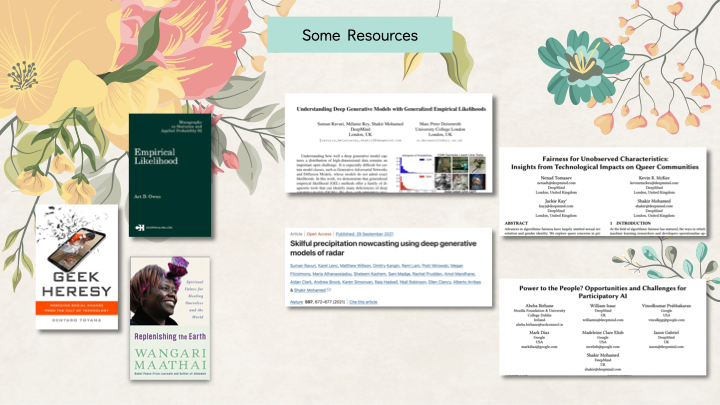
As a short postscript, here are some resources to followup on. Three books. And some of the papers I used in the talk and worked on, and with many incredible collaborators over the years. Again, my deep thanks to you all.